Emotional Footprint Awards 2020
Business Intelligence
SoftwareReviews names Dundas BI, Salesforce Einstein Analytics, Tableau, and Domo as Business Intelligence Emotional Footprint Award Winners.
View Category
Business Intelligence
Emotional Footprint Awards
SoftwareReviews Emotional Footprint Awards evaluate and rank products based on emotional response ratings from IT and business professionals. Using our Emotional Footprint methodology, we aggregate emotional footprint scores across 26 dimensions of the vendor-client relationship and product effectiveness, creating a powerful indicator of overall user feeling toward the vendor and product.
Emotional Footprint Awards are proudly founded in 100% user review data and are free of traditional “magical” components such as market presence and analyst opinion, which are opaque in nature and may be influenced by vendor pressure, financial or otherwise.
Read The In-Depth Report
See how each vendor stacks up across each of the 26 dimensions and our thorough evaluation of vendor capabilities, product features, and overall satisfaction.
30+ pages

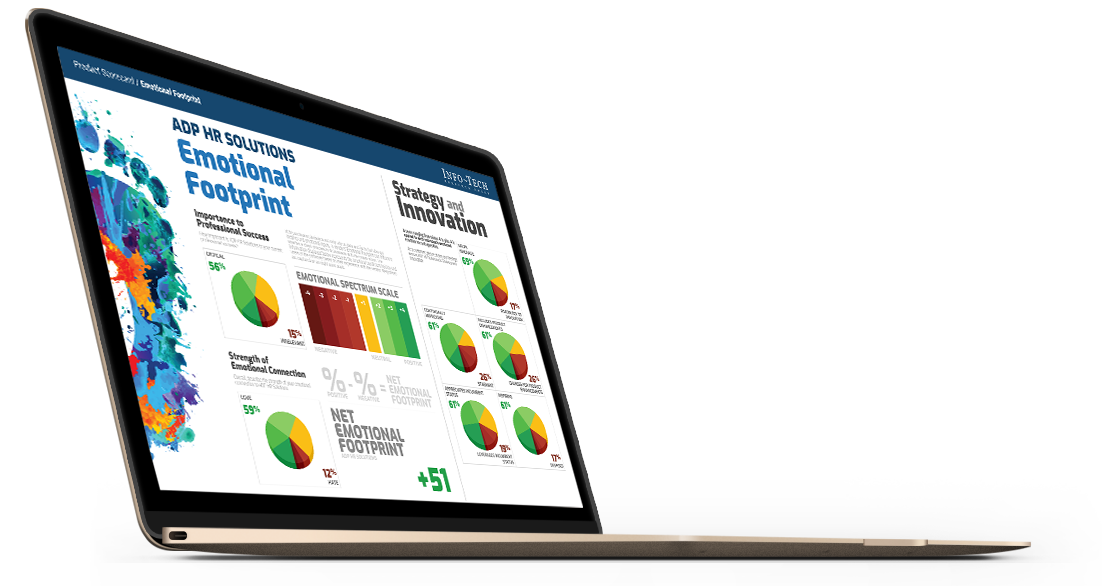
Measuring Emotional Footprint
Emotional Footprint is scored using our “Net Emotional Footprint” Index. This index tracks responses across 26 dimensions of emotional footprint that span 5 categories: Purchasing, Service Experience, Product Impact, Vendor Strategy, and Conflict Resolution. Then, the following calculation is done across this index:
% of Positive Reviews - % of Negative Reviews
For clarity, the total percentage of positive, neutral, and negative ratings is shown for each vendor as well.
Emotional Footprint Leaders
Dundas Data Visualization
Dundas BI
Dundas BI gives you full control over your data so you can create stunning dashboards, embedded analytics and a personal user experience. Your business gets more than just data exploration, it gets the perfect delivery needed to act on it.
8.4
CX Score
CX
Score
+82
Net Emotional Footprint
Net Emotional
Footprint
86
Value Index
VALUE INDEX
Salesforce.Com Inc
Salesforce Einstein Analytics
Now you can get comprehensive analysis of millions of data combinations in minutes. Einstein Discovery delivers AI-driven answers, explanations, and recommendations, so you not only understand what happened — but why it happened — and what you should do next.
8.4
CX Score
CX
Score
+85
Net Emotional Footprint
Net Emotional
Footprint
82
Value Index
VALUE INDEX
Tableau Software
Tableau
Data prep for messy spreadsheets, instant analytics, and improved performance. It's smart meets fast.
8.1
CX Score
CX
Score
+82
Net Emotional Footprint
Net Emotional
Footprint
81
Value Index
VALUE INDEX
Domo
Domo
Domo brings your business and all its data together in one intuitive platform. With Domo, it's easy to see the information you care about in one place and use it to make faster, better-informed decisions.
8.1
CX Score
CX
Score
+83
Net Emotional Footprint
Net Emotional
Footprint
80
Value Index
VALUE INDEX
Other Evaluated Vendors
SAS Institute Inc.
SAS Business Intelligence
Get the right information to anyone who needs it. Integrate and discover data on your own. Create and share interactive reports. Spark your curiosity with easy-to-use analytics. And monitor key metrics so when something goes awry, you'll know why – and what to do about it.
7.8
CX Score
CX
Score
+77
Net Emotional Footprint
Net Emotional
Footprint
80
Value Index
VALUE INDEX

IBM
IBM Cognos Platform
The IBM® Cognos® platform is an open, enterprise-class platform that can provide your users with the business intelligence (BI) and performance management content they need to understand your business and help improve results.
7.8
CX Score
CX
Score
+74
Net Emotional Footprint
Net Emotional
Footprint
82
Value Index
VALUE INDEX
Looker
Looker
Looker is a platform for data that streamlines the data supply chain to create actionable information. It allows any organization to extract value from their data at web-scale, delivers powerful purpose built applications to address the needs of specific teams, and provides a flexible, embedded analytics framework with Powered by Looker.
7.8
CX Score
CX
Score
+77
Net Emotional Footprint
Net Emotional
Footprint
79
Value Index
VALUE INDEX
TIBCO Software
TIBCO Business Intelligence
TIBCO Software Inc. is a global leader in infrastructure and business intelligence software. Whether it's optimizing inventory, cross-selling products, or averting crisis before it happens, TIBCO uniquely delivers the Two-Second Advantage® - the ability to capture the right information at the right time and act on it preemptively for a competitive advantage.
7.7
CX Score
CX
Score
+76
Net Emotional Footprint
Net Emotional
Footprint
79
Value Index
VALUE INDEX
Oracle
Oracle Analytics Cloud
Oracle Analytics is a comprehensive solution to meet the breadth of all analytics needs. Get the right data, to the right people, at the right time with analytics for everyone in your organization. With built-in security and governance, you can easily share insights and collaborate with your colleagues. By leveraging the cloud, you can scale up or down to suit your needs.
7.6
CX Score
CX
Score
+71
Net Emotional Footprint
Net Emotional
Footprint
82
Value Index
VALUE INDEX
Board International
Board
Within one single product Board offers all the functionalities needed to build any Business Intelligence Software and Corporate Performance Management application solutions without the use of any programming. Its revolutionary toolkit approach as well as delivering unrivalled speed in BI and CPM application building, customisation and maintenance, provides end-users with an advanced interactive interface. This unique capability turns the self-service creation of any report or analysis into the simplest of tasks.
7.6
CX Score
CX
Score
+73
Net Emotional Footprint
Net Emotional
Footprint
80
Value Index
VALUE INDEX

Sisense
Sisense
SiSense liberates data, empowers business users and frees IT by making it easy to do the difficult tasks of accessing, joining and visualizing data.
7.6
CX Score
CX
Score
+78
Net Emotional Footprint
Net Emotional
Footprint
74
Value Index
VALUE INDEX

Microsoft
Microsoft Power BI
Power BI is a business analytics solution that lets you visualize your data and share insights across your organization, or embed them in your app or website. Connect to hundreds of data sources and bring your data to life with live dashboards and reports.
7.5
CX Score
CX
Score
+70
Net Emotional Footprint
Net Emotional
Footprint
81
Value Index
VALUE INDEX
QlikTech
Qlik Sense
Qlik Sense is a business intelligence (BI) and visual analytics platform that supports a range of analytic use cases. Built on Qlik’s unique Associative Engine, it supports a full range of users and use-cases across the life-cycle from data to insight – with self-service analytics, interactive dashboards, conversational analytics, custom and embedded analytics, mobile analytics, and reporting. The solution comes in three different editions - Qlik Sense Enterprise, Business, and Team. Qlik Sense can be deployed in the cloud or on-premises.
7.5
CX Score
CX
Score
+73
Net Emotional Footprint
Net Emotional
Footprint
76
Value Index
VALUE INDEX
Yellowfin
Yellowfin
At Yellowfin we are passionate about making Business Intelligence easy. As an emerging software developer on the local and international scene, Yellowfin provides 100% web-based embeddable reporting and analytics.
7.4
CX Score
CX
Score
+74
Net Emotional Footprint
Net Emotional
Footprint
74
Value Index
VALUE INDEX
SAP
SAP BusinessObjects
SAP BusinessObjects BI is a reporting and analytics business intelligence (BI) platform aimed at business users. It consists of a number of reporting applications that allow users to discover data, perform analysis to derive insights and create reports that visualize the insights.
7.1
CX Score
CX
Score
+67
Net Emotional Footprint
Net Emotional
Footprint
75
Value Index
VALUE INDEX
MicroStrategy
MicroStrategy
MicroStrategy 10 meets the needs of both business and IT. Make sense of large data volumes, get answers in an instant, build stunning visualizations, and ensure a single version of the truth securely, at any scale, on every device.
6.9
CX Score
CX
Score
+68
Net Emotional Footprint
Net Emotional
Footprint
71
Value Index
VALUE INDEX
For the full list of vendors in this space, click here.
Get Instant Access<br>to this Report
Get Instant Access
to this Report
Unlock your first report with just a business email. Register to access our entire library.
© 2026 SoftwareReviews.com. All rights reserved.