
What is SAS Visual Analytics?
A single application for reporting, data exploration and analytics. Interactive reporting. Visual discovery. Self-service analytics. Scalability and governance. All from a single, powerful in-memory environment.
Company Details
Need Assistance?
We're here to help you with understanding our reports and the data inside to help you make decisions.
Get AssistanceSAS Visual Analytics Ratings
Real user data aggregated to summarize the product performance and customer experience.
Product scores listed below represent current data. This may be different from data contained in reports and awards, which express data as of their publication date.
84 Likeliness to Recommend
92 Plan to Renew
75 Satisfaction of Cost Relative to Value
Emotional Footprint Overview
Product scores listed below represent current data. This may be different from data contained in reports and awards, which express data as of their publication date.
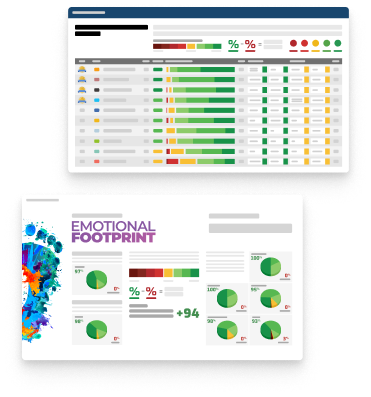
+94 Net Emotional Footprint
The emotional sentiment held by end users of the software based on their experience with the vendor. Responses are captured on an eight-point scale.
How much do users love SAS Visual Analytics?
Pros
- Trustworthy
- Saves Time
- Security Protects
- Reliable
How to read the Emotional Footprint
The Net Emotional Footprint measures high-level user sentiment towards particular product offerings. It aggregates emotional response ratings for various dimensions of the vendor-client relationship and product effectiveness, creating a powerful indicator of overall user feeling toward the vendor and product.
While purchasing decisions shouldn't be based on emotion, it's valuable to know what kind of emotional response the vendor you're considering elicits from their users.
Footprint
Negative
Neutral
Positive
Feature Ratings
Spatial Analysis
BI Platform Administration
Advanced Analytics and Data Science
Data Modelling Tools
Dashboard
BI Security
Operational Reporting Capabilities
Collaboration
Data Exploration and Visualization
Data Connectors and Data Mashup
Real-Time Visualization
Vendor Capability Ratings
Business Value Created
Quality of Features
Vendor Support
Ease of IT Administration
Ease of Data Integration
Ease of Implementation
Usability and Intuitiveness
Ease of Customization
Availability and Quality of Training
Breadth of Features
Product Strategy and Rate of Improvement
Also Featured in...
SAS Visual Analytics Reviews

Michael H.
- Role: Finance
- Industry: Insurance
- Involvement: End User of Application
Submitted Jul 2021
Big data analytics tool
Likeliness to Recommend
What differentiates SAS Visual Analytics from other similar products?
SAS Business Intelligence can handle billions of rows of data without any issues and runs quickly.
What is your favorite aspect of this product?
Easy to manipulate data and run processes.
What do you dislike most about this product?
Complicated analysis need a certain level of coding and coding experience to make the process efficiently
What recommendations would you give to someone considering this product?
Have someone who has SQL or a similar background in coding.
Pros
- Helps Innovate
- Reliable
- Performance Enhancing
- Enables Productivity
Please tell us why you think this review should be flagged.

Aman F.
- Role: Consultant
- Industry: Engineering
- Involvement: Business Leader or Manager
Submitted May 2021
Easy to use, but a bit ancient
Likeliness to Recommend
What differentiates SAS Visual Analytics from other similar products?
Sas is well integrated with other technologies and adopted by industry
What is your favorite aspect of this product?
Uts usability by wide range of technical people
What do you dislike most about this product?
Feels ancient to use because of user interface
What recommendations would you give to someone considering this product?
By it without any doubts
Pros
- Trustworthy
- Unique Features
- Respectful
- Generous Negotitation
Please tell us why you think this review should be flagged.

George N.
- Role: Consultant
- Industry: Healthcare
- Involvement: End User of Application
Submitted Mar 2021
Best BI tool for Data analysis and reporting
Likeliness to Recommend
What differentiates SAS Visual Analytics from other similar products?
Use from anywhere - SAS BI provides flexibility and you can use form anywhere with internet connection. It also integrates well on a number of devices including tablets, mobile phones and laptops with a variety of operating systems and apps. Drag and Drop Interface - This is a primary feature that makes SAS BI tools so amazing and its intuitive. Allowing you to literally choose from an array of options to arrange and organize them how you want. Simplicity of use is also unique as you do not need sharp IT skills to use it.
What is your favorite aspect of this product?
This product just fits perfectly to my job which involves analyzing data, which this product really helps with the many tools that includes data mining and analyzing. We use the SAS BI as our analytical tool, with basic SQL knowledge its very easy to learn the tool. With just a few lines of code you are able to execute complex business questions. The ability to build out macros is great.
What do you dislike most about this product?
When consulting for small companies, the cost of software is a bit expensive. You will also need SAS coding as you move to advance level of data preparation.
What recommendations would you give to someone considering this product?
This is one of the best tools that helps you analyze customers, products and performance all at once. you are able to tell the health performance and the direction of your organization. I recommend it for a growing company that needs prospective leads on its performance.
Pros
- Helps Innovate
- Reliable
- Performance Enhancing
- Enables Productivity
Please tell us why you think this review should be flagged.
Get Instant Access<br>to this Report
Get Instant Access
to this Report
Unlock your first report with just a business email. Register to access our entire library.
© 2026 SoftwareReviews.com. All rights reserved.