
What is SAS Visual Analytics?
A single application for reporting, data exploration and analytics. Interactive reporting. Visual discovery. Self-service analytics. Scalability and governance. All from a single, powerful in-memory environment.
Company Details
Need Assistance?
We're here to help you with understanding our reports and the data inside to help you make decisions.
Get AssistanceSAS Visual Analytics Ratings
Real user data aggregated to summarize the product performance and customer experience.
Product scores listed below represent current data. This may be different from data contained in reports and awards, which express data as of their publication date.
84 Likeliness to Recommend
92 Plan to Renew
75 Satisfaction of Cost Relative to Value
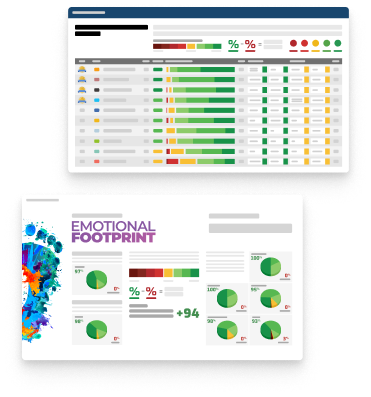
Emotional Footprint Overview
Product scores listed below represent current data. This may be different from data contained in reports and awards, which express data as of their publication date.
+94 Net Emotional Footprint
The emotional sentiment held by end users of the software based on their experience with the vendor. Responses are captured on an eight-point scale.
How much do users love SAS Visual Analytics?
Pros
- Trustworthy
- Saves Time
- Security Protects
- Reliable
How to read the Emotional Footprint
The Net Emotional Footprint measures high-level user sentiment towards particular product offerings. It aggregates emotional response ratings for various dimensions of the vendor-client relationship and product effectiveness, creating a powerful indicator of overall user feeling toward the vendor and product.
While purchasing decisions shouldn't be based on emotion, it's valuable to know what kind of emotional response the vendor you're considering elicits from their users.
Footprint
Negative
Neutral
Positive
Feature Ratings
Spatial Analysis
BI Platform Administration
Advanced Analytics and Data Science
Data Modelling Tools
Dashboard
BI Security
Operational Reporting Capabilities
Collaboration
Data Exploration and Visualization
Data Connectors and Data Mashup
Real-Time Visualization
Vendor Capability Ratings
Business Value Created
Quality of Features
Vendor Support
Ease of IT Administration
Ease of Data Integration
Ease of Implementation
Usability and Intuitiveness
Ease of Customization
Availability and Quality of Training
Breadth of Features
Product Strategy and Rate of Improvement
Also Featured in...
SAS Visual Analytics Reviews
- Role: Information Technology
- Industry: Technology
- Involvement: IT Leader or Manager
Submitted Feb 2023
Great product
Likeliness to Recommend
Pros
- Helps Innovate
- Continually Improving Product
- Reliable
- Performance Enhancing
Cons
- Less Generous
Please tell us why you think this review should be flagged.
Joshua M.
- Role: Information Technology
- Industry: Food and Beverage
- Involvement: End User of Application
Submitted Feb 2023
Highly Reliable and Easy to Manage
Likeliness to Recommend
What differentiates SAS Visual Analytics from other similar products?
The capabilities of SAS Business Intelligence & Analytics has been excellent. Moreover, SAS Business Intelligence & Analytics surpasses its competitors because of its accuracy when it comes to offering insights.
What is your favorite aspect of this product?
I like the ease of use of SAS Business Intelligence & Analytics. SAS Business Intelligence & Analytics is also an affordable business intelligence software.
What do you dislike most about this product?
The features of SAS Business Intelligence & Analytics are all incredible. I do not dislike anything about SAS Business Intelligence & Analytics.
What recommendations would you give to someone considering this product?
SAS Business Intelligence & Analytics is an impressive and accurate business intelligence software. I do recommend SAS Business Intelligence & Analytics.
Pros
- Helps Innovate
- Continually Improving Product
- Reliable
- Performance Enhancing
Please tell us why you think this review should be flagged.

Kevin S.
- Role: Information Technology
- Industry: Technology
- Involvement: End User of Application
Submitted Jan 2023
Easy to use product with nice creative dashboard
Likeliness to Recommend
What differentiates SAS Visual Analytics from other similar products?
Its creative and attractive dashboard is different and its visualization capabilities is far better than other BI tools and also data analysis can be also easily done using multiple file formats like .xls,.csv etcetra.
What is your favorite aspect of this product?
Its dashboard creativity and the Data Visualization
What do you dislike most about this product?
Its security and scalability is not up to the mark and does not have 2- factor authentication
What recommendations would you give to someone considering this product?
Recommendable for creating attractive dashboards
Pros
- Helps Innovate
- Continually Improving Product
- Reliable
- Trustworthy
Please tell us why you think this review should be flagged.
Get Instant Access<br>to this Report
Get Instant Access
to this Report
Unlock your first report with just a business email. Register to access our entire library.
© 2026 SoftwareReviews.com. All rights reserved.