
What is SAS Visual Analytics?
A single application for reporting, data exploration and analytics. Interactive reporting. Visual discovery. Self-service analytics. Scalability and governance. All from a single, powerful in-memory environment.
Company Details
Need Assistance?
We're here to help you with understanding our reports and the data inside to help you make decisions.
Get AssistanceSAS Visual Analytics Ratings
Real user data aggregated to summarize the product performance and customer experience.
Download the entire Product Scorecard
to access more information on SAS Visual Analytics.
Product scores listed below represent current data. This may be different from data contained in reports and awards, which express data as of their publication date.
80 Likeliness to Recommend
96 Plan to Renew
75 Satisfaction of Cost Relative to Value
2
Since last award
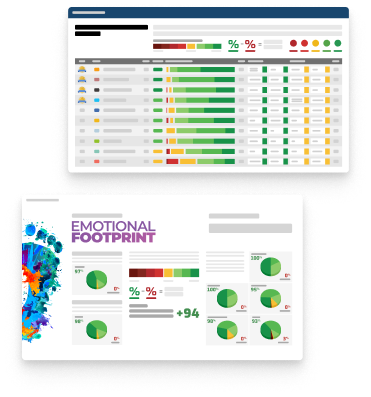
Emotional Footprint Overview
Product scores listed below represent current data. This may be different from data contained in reports and awards, which express data as of their publication date.
+88 Net Emotional Footprint
The emotional sentiment held by end users of the software based on their experience with the vendor. Responses are captured on an eight-point scale.
How much do users love SAS Visual Analytics?
Pros
- Efficient Service
- Respectful
- Fair
- Reliable
How to read the Emotional Footprint
The Net Emotional Footprint measures high-level user sentiment towards particular product offerings. It aggregates emotional response ratings for various dimensions of the vendor-client relationship and product effectiveness, creating a powerful indicator of overall user feeling toward the vendor and product.
While purchasing decisions shouldn't be based on emotion, it's valuable to know what kind of emotional response the vendor you're considering elicits from their users.
Footprint
Negative
Neutral
Positive
Feature Ratings
BI Platform Administration
Dashboard
BI Security
Operational Reporting Capabilities
Collaboration
Data Exploration and Visualization
Data Connectors and Data Mashup
Intelligent Alerts and Notifications
Self Service and Ad Hoc Capabilities
Mobile
Vendor Capability Ratings
Ease of Implementation
Quality of Features
Ease of Customization
Availability and Quality of Training
Ease of IT Administration
Business Value Created
Ease of Data Integration
Product Strategy and Rate of Improvement
Usability and Intuitiveness
Vendor Support
Breadth of Features
SAS Visual Analytics Reviews
Casndra M.
- Role: Industry Specific Role
- Industry: Manufacturing
- Involvement: Business Leader or Manager
Submitted Jun 2022
An amazing platform for business intelligence.
Likeliness to Recommend
What differentiates SAS Visual Analytics from other similar products?
SAS Business Intelligence is very straightforward to configure and automate. It comes with several functions predefined, which makes it very convenient to form panels and reports that has our users the power to play with data. With SAS Business Intelligence, we are able to duplicate all business logic and system calculations on our native desktop within the most effective method possible.
What is your favorite aspect of this product?
It is terribly simple to present complicated info in a exceedingly model that’s simple to comprehend. It permits users to save lots of reports for use in their future queries with the Business Objects functions. Also, to understand and make panels, you don’t ought to be from an IT or programming environment, as all the method is mechanical and easy when we enforced SAS Bi in our organization, we had to be able to filter massive information sets and drop comparison teams into graphs, and that’ precisely what this great tool has offered us.
What do you dislike most about this product?
The value of SAS Business Intelligence is extremely high, that makes it too expensive for a few companies. At first, the setup and administration of the software system are troublesome if the right individuals to modify the merchandise effectively aren’t available.
What recommendations would you give to someone considering this product?
SAS Bi is best fitted to a giant company, wherever most users aren’t technically skilled in looking for self-service Bi platforms. If you have got sturdy IT help or someone with IT expertise in your team, the appliance of SAS Bi can work better.
Pros
- Reliable
- Enables Productivity
- Efficient Service
- Inspires Innovation
Please tell us why you think this review should be flagged.
- Role: Information Technology
- Industry: Banking
- Involvement: IT Leader or Manager
Submitted Jul 2021
SAS is a Definite Industry Leader Since 1972
Likeliness to Recommend
Pros
- Helps Innovate
- Continually Improving Product
- Reliable
- Performance Enhancing
Please tell us why you think this review should be flagged.

Himanshu S.
- Role: Sales Marketing
- Industry: Education
- Involvement: Business Leader or Manager
Submitted Jul 2021
Easy to implement and easy to use BI
Likeliness to Recommend
What differentiates SAS Visual Analytics from other similar products?
Statistical analysis, Customer analysis is smooth and superior on BI.
What is your favorite aspect of this product?
From the first step, it is efficient and easy to set up and provide training to staff.
What do you dislike most about this product?
It is more on the expensive side. It is slower than other BI tools.
What recommendations would you give to someone considering this product?
If you can afford this software and adjust with a little outdated UI, it will help you a lot in analysis.
Pros
- Caring
- Security Protects
- Reliable
- Performance Enhancing
Cons
- Under Delivered
Please tell us why you think this review should be flagged.






Get Instant Access<br>to this Report
Get Instant Access
to this Report
Unlock your first report with just a business email. Register to access our entire library.
© 2026 SoftwareReviews.com. All rights reserved.