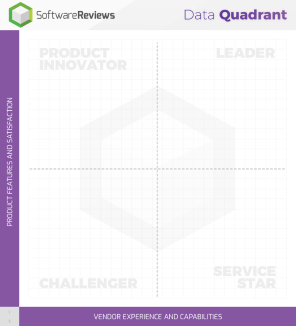
Product Innovator
Leader
Challenger
Service Star
2022 Security Orchestration, Automation, and Response Data Quadrant
2022 Security Orchestration, Automation, and Response Emotional Footprint
30+ pages
The Data Quadrant Buyer's Guide provides a comprehensive evaluation of the top software in the Security Orchestration, Automation, and Response market. Data is collected from real users, meticulously verified and visualized in easy-to-understand charts and graphs. Each product is compared against the best Security Orchestration, Automation, and Response to create a holistic, unbiased view of the product landscape.
The Data Quadrant Buyer's Guide is a summation of hundreds of data points that gives you a quick snapshot of the market. Use this detailed report to quickly validate your top features and shortlist your top contenders.
For even more detailed reports on individual products, see the Product Reports.
The Data Quadrant measures the complete software experience, comparing both the experience with the software and the relationship with the vendor.
Product Feature & Satisfaction: Satisfaction with the software is measured by combining users’ satisfaction with the top features with the likelihood of users to recommend the software.
Vendor Experience & Capabilities: The vendor experience is calculated using a weighted average of the satisfaction scores tied to vendor capabilities (e.g. software implementation, training, customer support, product roadmap) and the working relationship with the vendor (e.g. whether the vendor is trustworthy, respectful, fair).
30+ pages
The Emotional Footprint Buyer’s Guide captures the overall experience of working with a software vendor and their platform. Organizations increasingly rely on software vendors to be true partners to help improve their operations. The Emotional Footprint helps you understand how you can trust and rely on the vendor to support you through your relationship.
We collect 25 data points outlining that experience, from the initial contracting and negotiation phase, though how they will support you during conflicts, to how their overall product strategy and direction will help you improve. Use this report to understand which vendors focus on building relationships to create a loyal customer base.
The Emotional Diamond helps identify which vendors provide the best overall experience when compared against the perceived value of the software.
Value Index: Software pricing can be complicated and confusing, but knowing if you’re getting business value for the price you're paying is not. The Value Index metric captures users’ satisfaction with their software given the costs.
Net Emotional Footprint: The Net Emotional Footprint measures high-level user sentiment. It aggregates emotional response ratings across 25 provocative questions, creating a powerful indicator of overall user feeling toward the vendor and product.
The SoftwareReviews Data Quadrant evaluates and ranks products based on feedback from real users. This annual report captures performance of leading vendors across two key areas: Vendor Capabilities and Product Features. Use this report to help compare your top software choices and shortlist the best alternatives for your organization.
SoftwareReviews examines 11 core capabilities common across all software vendors. These capabilities represent table-stakes expectations for any software platform, and are critical to driving a strong, long-term relationship between the vendor and their customers.
Compare top features in each category, identifying what is important to your business. Features have been chosen based on market relevancy and typical use within the category. Features listed as mandatory are required to considered for participation in the category, while standard features are optional to qualify, but still flagged as important.
Info-Tech’s Data Quadrant Reports provide a comprehensive evaluation of popular products in the Security Orchestration, Automation, and Response market. This buyer’s guide is designed to help prospective purchasers make better decisions by leveraging the experiences of real users.
The data in this report is collected from real end users, meticulously verified for veracity, exhaustively analyzed, and visualized in easy to understand charts and graphs. Each product is compared and contrasted with all other products in the category to create a holistic, unbiased view of the product landscape.
Use this report to determine which product is right for your organization. For highly detailed reports on individual products, see Info-Tech’s Product Scorecard.
This report is available free of charge for internal use only to assist with software evaluation and selection. Sharing, republishing, distributing, or otherwise copying any portion of this report without the express written consent of SoftwareReviews.com is strictly prohibited.
© 2022 SoftwareReviews.com. All rights reserved.
Selecting software can be overwhelming and one of the biggest challenges facing organizations is understanding the marketplace and identifying all of the available vendors and products. The Software Directory is a comprehensive list of all relevant software products in a particular category. Use this page to create the right product shortlist by exploring all of the options available to your organization.
Cloud SOAR
Cortex XSOAR
CyberRes ArcSight
Exabeam Response Automation
FireEye Helix SOAR
FortiSOAR
IBM Security QRadar SOAR
LogicHub SOAR+
LogPoint SOAR
Siemplify SOAR Platform
SIRP SOAR Platform
Splunk SOAR
Swimlane Platform
ThreatConnect SOAR
ThreatQ
Tines
XGEN SOAR
Assess vendor and product performance at a glance and use the SoftwareReviews Data Quadrant to identify which products and vendors are leadings the pack and which are trailing.
The Software Reviews Data Quadrant evaluates and ranks products based on feedback from IT and business professionals. The placement of a software in the Data Quadrant indicates its relative ranking as well as its categorization.
When distilled down, the software experience is shaped by both the experience with the software and the relationship with the vendor. Evaluating enterprise software along these two dimensions provides a comprehensive understanding of the product and helps identify vendors that can deliver on both.
The satisfaction is captured in the overall satisfaction score, which is driven by the likelihood of users to recommend the software, combined with user satisfaction across top product features.
The vendor relationship is calculated in a weighted average of the satisfaction scores tied to vendor capabilities (e.g. software implementation, training, customer support, product roadmap) as well as emotional response ratings toward the vendor (e.g. trustworthy, respectful, fair).
Note: The axes ranges are dynamically adjusted based on minimum and maximum values in the dataset.
This page provides a high level summary of product performance within the Security Orchestration, Automation, and Response category. Products are ranked by a composite satisfaction score (Composite Score) that averages four different areas of evaluation: Net Emotional Footprint, Vendor Capabilities, Product Features, and Likeliness to Recommend. The Net Emotional Footprint Score measures user emotional response ratings of the vendor (e.g. trustworthy, respectful, fair).
Use this data to get a sense of the field, and to see how the products you’re considering stack up.
Rank | Product | Composite Score | Net Emotional Footprint |
Net Emotional Footprint Distribution |
Vendor Capabilities | Product Features | Likeliness to Recommend |
Number of Reviews |
---|---|---|---|---|---|---|---|---|
![]() |
![]() |
9.6/10 |
+100
|
-- Negative 100% Positive | 94% | 90% | 99% | 11 |
![]() |
![]() |
8.6/10 |
+87
|
4% Negative 91% Positive | 83% | 83% | 92% | 20 |
![]() |
![]() |
8.6/10 |
+89
|
2% Negative 91% Positive | 83% | 79% | 92% | 14 |
4 |
![]() |
8.5/10 |
+96
|
-- Negative 96% Positive | 78% | 82% | 82% | 10 |
5 |
![]() |
8.3/10 |
+89
|
3% Negative 92% Positive | 77% | 80% | 88% | 12 |
6 |
![]() |
8.0/10 |
+85
|
3% Negative 88% Positive | 80% | 71% | 86% | 11 |
7 |
![]() |
7.7/10 |
+85
|
4% Negative 89% Positive | 72% | 72% | 79% | 10 |
Average Scores | 8.4/10 |
+90
|
2% Negative 92% Positive | 81% | 79% | 88% | 13 |
Products with Insufficient Data | ||||||||
---|---|---|---|---|---|---|---|---|
-- |
![]() |
8.3/10 |
+91
|
-- Negative 92% Positive | 78% | 83% | 82% | 5 |
This page summarizes user satisfaction with a variety of vendor capabilities regarding their product offering(s). Look for strong and consistent performance across the board when assembling your shortlist, and follow-up on areas of concern during the evaluation and negotiation processes.
Product | Overall Capability Satisfaction | Business Value Created | Breadth of Features | Quality of Features | Product Strategy and Rate of Improvement | Usability And Intuitiveness | Vendor Support | Ease of Data Integration | Ease of Administration | Ease of Customization | Availability and Quality of Training | Ease of Implementation |
---|---|---|---|---|---|---|---|---|---|---|---|---|
Tines | 94% | 93% | 89% | 95% | 98% | 91% | 100% | 98% | 95% | 95% | 86% | 95% |
IBM Security QRadar SOAR | 83% | 84% | 91% | 89% | 84% | 84% | 86% | 80% | 78% | 80% | 84% | 77% |
Swimlane Platform | 83% | 84% | 84% | 80% | 83% | 81% | 89% | 85% | 80% | 84% | 80% | 80% |
Splunk SOAR | 80% | 84% | 80% | 75% | 73% | 82% | 73% | 84% | 73% | 80% | 84% | 89% |
FortiSOAR | 78% | 75% | 80% | 82% | 75% | 85% | 69% | 85% | 80% | 75% | 67% | 80% |
Siemplify SOAR Platform | 77% | 77% | 75% | 75% | 73% | 77% | 75% | 80% | 80% | 77% | 75% | 77% |
FireEye Helix SOAR | 72% | 68% | 80% | 75% | 70% | 73% | 78% | 73% | 70% | 67% | 70% | 73% |
CATEGORY AVERAGE | 81% | 81% | 83% | 82% | 79% | 82% | 81% | 83% | 80% | 80% | 78% | 82% |
Products with insufficient data | ||||||||||||
---|---|---|---|---|---|---|---|---|---|---|---|---|
Cloud SOAR | 78% | 70% | 75% | 80% | 75% | 80% | 85% | 90% | 80% | 80% | 60% | 80% |
This section provides detailed information on user satisfaction for each vendor capability regarding their product offering(s). Use these pages to dig deeper into areas of particular interest or concern.
This table lists and briefly describes all vendor capabilities that are evaluated in the Security Orchestration, Automation, and Response software category. For your convenience, you will also find longer descriptions of the capabilities under the capability subheadings in the subsequent pages.
Business Value Created |
The underlying purpose of software is to create value for employees, customers, partners and ultimately shareholders. As a result, it is imperative that any software selection be aligned with the organization’s needs and deliver enough business value to justify the cost. The data below highlights the satisfaction level associated with the business value derived from various product offerings. Use this information to identify the software that consistently creates business value for its customers. |
Breadth of Features |
Users prefer to work with feature rich software that enables them to perform diverse series of tasks as opposed to one they find restrictive. The data below highlights the satisfaction level associated with the breadth of features from various product offerings. Use this information to identify which software offers valuable comprehensive functionality that extends beyond the basic level. |
Quality of Features |
Feature quality is just as important as quantity. Software needs to do what you’re purchasing it to do, easily, intuitively, reliably, and effectively. Use the data in this section to gauge whether or not a product follows through on the marketing hype by delivering high quality features. |
Product Strategy and Rate of Improvement |
Purchasing software can be a significant commitment, so it’s important to know if your vendor is serious about the need for constant improvement and deliberate strategic direction. Vendors who don’t stay on top of emerging needs and trends won’t enable you to meet your business goals. Use the data in this section to separate innovators from imposters. |
Usability And Intuitiveness |
End user learning curves cost the organization money. Pay attention to your end users’ technical ability to determine how important UX is in your purchase. |
Vendor Support |
The importance of vendor support will vary for each organization depending on internal capabilities, but there will always be issues that only the vendor can resolve. Use the data in this section to see which vendors tend to under-service their product and which will offer quality support. |
Ease of Data Integration |
The ability to integrate with other systems is increasingly important; without this, manual data loading and extraction can be time-consuming and prone to error. Use this section to see which vendors will cause headaches and which will make data integration easy. |
Ease of Administration |
Administrative interfaces don’t get the same attention as those built for end users, but they shouldn’t be clunky or unintuitive. Use the data in this section to determine which vendors make administration easy, so that your IT personnel can resolve issues and perform configurations efficiently and effectively. |
Ease of Customization |
Out-of-the-box functionality often isn’t enough, especially for niche or industry-specific software, and the reason you’re buying rather than building is to save time and money in the first place. Don’t get bogged down in a difficult customization; use the data in this section to make sure you can easily achieve the functionality you need for your particular situation. |
Availability and Quality of Training |
Effective and readily available training enables users to get the most out of the software you’ve chosen. Use this section to make sure your vendor’s training programs and materials measure up. |
Ease of Implementation |
Choosing the right software is only the first step. Successfully implementing the new solution is necessary in order to realize its full value and promote end user adoption. Use the data in this section to determine which software is easy to implement, and which may jeopardize your goals by causing trouble in this stage. |
This section provides detailed information on user satisfaction for each vendor capability regarding their product offering(s). Use these pages to dig deeper into areas of particular interest or concern.
The underlying purpose of software is to create value for employees, customers, partners and ultimately shareholders. As a result, it is imperative that any software selection be aligned with the organization’s needs and deliver enough business value to justify the cost. The data below highlights the satisfaction level associated with the business value derived from various product offerings. Use this information to identify the software that consistently creates business value for its customers.
2 |
|
|
84% | 20 REVIEWS |
3 |
|
|
84% | 11 REVIEWS |
4 |
|
|
84% | 14 REVIEWS |
5 |
|
|
77% | 12 REVIEWS |
6 |
|
|
75% | 10 REVIEWS |
7 |
|
|
68% | 10 REVIEWS |
Category Average |
81% |
---|
Products with Insufficient Data | ||||
-- |
|
|
70% | 5 REVIEWS |
This section provides detailed information on user satisfaction for each vendor capability regarding their product offering(s). Use these pages to dig deeper into areas of particular interest or concern.
Users prefer to work with feature rich software that enables them to perform diverse series of tasks as opposed to one they find restrictive. The data below highlights the satisfaction level associated with the breadth of features from various product offerings. Use this information to identify which software offers valuable comprehensive functionality that extends beyond the basic level.
2 |
|
|
89% | 11 REVIEWS |
3 |
|
|
84% | 20 REVIEWS |
4 |
|
|
80% | 10 REVIEWS |
5 |
|
|
80% | 10 REVIEWS |
6 |
|
|
80% | 11 REVIEWS |
7 |
|
|
75% | 12 REVIEWS |
Category Average |
83% |
---|
Products with Insufficient Data | ||||
-- |
|
|
75% | 5 REVIEWS |
This section provides detailed information on user satisfaction for each vendor capability regarding their product offering(s). Use these pages to dig deeper into areas of particular interest or concern.
Feature quality is just as important as quantity. Software needs to do what you’re purchasing it to do, easily, intuitively, reliably, and effectively. Use the data in this section to gauge whether or not a product follows through on the marketing hype by delivering high quality features.
2 |
|
|
89% | 14 REVIEWS |
3 |
|
|
82% | 10 REVIEWS |
4 |
|
|
80% | 20 REVIEWS |
5 |
|
|
75% | 12 REVIEWS |
6 |
|
|
75% | 11 REVIEWS |
7 |
|
|
75% | 10 REVIEWS |
Category Average |
82% |
---|
Products with Insufficient Data | ||||
-- |
|
|
80% | 5 REVIEWS |
This section provides detailed information on user satisfaction for each vendor capability regarding their product offering(s). Use these pages to dig deeper into areas of particular interest or concern.
Purchasing software can be a significant commitment, so it’s important to know if your vendor is serious about the need for constant improvement and deliberate strategic direction. Vendors who don’t stay on top of emerging needs and trends won’t enable you to meet your business goals. Use the data in this section to separate innovators from imposters.
2 |
|
|
84% | 14 REVIEWS |
3 |
|
|
83% | 20 REVIEWS |
4 |
|
|
75% | 10 REVIEWS |
5 |
|
|
73% | 12 REVIEWS |
6 |
|
|
73% | 11 REVIEWS |
7 |
|
|
70% | 10 REVIEWS |
Category Average |
79% |
---|
Products with Insufficient Data | ||||
-- |
|
|
75% | 5 REVIEWS |
This section provides detailed information on user satisfaction for each vendor capability regarding their product offering(s). Use these pages to dig deeper into areas of particular interest or concern.
End user learning curves cost the organization money. Pay attention to your end users’ technical ability to determine how important UX is in your purchase.
2 |
|
|
85% | 10 REVIEWS |
3 |
|
|
84% | 14 REVIEWS |
4 |
|
|
82% | 11 REVIEWS |
5 |
|
|
81% | 20 REVIEWS |
6 |
|
|
77% | 12 REVIEWS |
7 |
|
|
73% | 10 REVIEWS |
Category Average |
82% |
---|
Products with Insufficient Data | ||||
-- |
|
|
80% | 5 REVIEWS |
This section provides detailed information on user satisfaction for each vendor capability regarding their product offering(s). Use these pages to dig deeper into areas of particular interest or concern.
The importance of vendor support will vary for each organization depending on internal capabilities, but there will always be issues that only the vendor can resolve. Use the data in this section to see which vendors tend to under-service their product and which will offer quality support.
2 |
|
|
89% | 20 REVIEWS |
3 |
|
|
86% | 14 REVIEWS |
4 |
|
|
78% | 10 REVIEWS |
5 |
|
|
75% | 12 REVIEWS |
6 |
|
|
73% | 11 REVIEWS |
7 |
|
|
69% | 10 REVIEWS |
Category Average |
81% |
---|
Products with Insufficient Data | ||||
-- |
|
|
85% | 5 REVIEWS |
This section provides detailed information on user satisfaction for each vendor capability regarding their product offering(s). Use these pages to dig deeper into areas of particular interest or concern.
The ability to integrate with other systems is increasingly important; without this, manual data loading and extraction can be time-consuming and prone to error. Use this section to see which vendors will cause headaches and which will make data integration easy.
2 |
|
|
85% | 20 REVIEWS |
3 |
|
|
85% | 10 REVIEWS |
4 |
|
|
84% | 11 REVIEWS |
5 |
|
|
80% | 14 REVIEWS |
6 |
|
|
80% | 12 REVIEWS |
7 |
|
|
73% | 10 REVIEWS |
Category Average |
83% |
---|
Products with Insufficient Data | ||||
-- |
|
|
90% | 5 REVIEWS |
This section provides detailed information on user satisfaction for each vendor capability regarding their product offering(s). Use these pages to dig deeper into areas of particular interest or concern.
Administrative interfaces don’t get the same attention as those built for end users, but they shouldn’t be clunky or unintuitive. Use the data in this section to determine which vendors make administration easy, so that your IT personnel can resolve issues and perform configurations efficiently and effectively.
2 |
|
|
80% | 20 REVIEWS |
3 |
|
|
80% | 10 REVIEWS |
4 |
|
|
80% | 12 REVIEWS |
5 |
|
|
78% | 14 REVIEWS |
6 |
|
|
73% | 11 REVIEWS |
7 |
|
|
70% | 10 REVIEWS |
Category Average |
80% |
---|
Products with Insufficient Data | ||||
-- |
|
|
80% | 5 REVIEWS |
This section provides detailed information on user satisfaction for each vendor capability regarding their product offering(s). Use these pages to dig deeper into areas of particular interest or concern.
Out-of-the-box functionality often isn’t enough, especially for niche or industry-specific software, and the reason you’re buying rather than building is to save time and money in the first place. Don’t get bogged down in a difficult customization; use the data in this section to make sure you can easily achieve the functionality you need for your particular situation.
2 |
|
|
84% | 20 REVIEWS |
3 |
|
|
80% | 14 REVIEWS |
4 |
|
|
80% | 11 REVIEWS |
5 |
|
|
77% | 12 REVIEWS |
6 |
|
|
75% | 10 REVIEWS |
7 |
|
|
67% | 10 REVIEWS |
Category Average |
80% |
---|
Products with Insufficient Data | ||||
-- |
|
|
80% | 5 REVIEWS |
This section provides detailed information on user satisfaction for each vendor capability regarding their product offering(s). Use these pages to dig deeper into areas of particular interest or concern.
Effective and readily available training enables users to get the most out of the software you’ve chosen. Use this section to make sure your vendor’s training programs and materials measure up.
2 |
|
|
84% | 11 REVIEWS |
3 |
|
|
84% | 14 REVIEWS |
4 |
|
|
80% | 20 REVIEWS |
5 |
|
|
75% | 12 REVIEWS |
6 |
|
|
70% | 10 REVIEWS |
7 |
|
|
67% | 10 REVIEWS |
Category Average |
78% |
---|
Products with Insufficient Data | ||||
-- |
|
|
60% | 5 REVIEWS |
This section provides detailed information on user satisfaction for each vendor capability regarding their product offering(s). Use these pages to dig deeper into areas of particular interest or concern.
Choosing the right software is only the first step. Successfully implementing the new solution is necessary in order to realize its full value and promote end user adoption. Use the data in this section to determine which software is easy to implement, and which may jeopardize your goals by causing trouble in this stage.
2 |
|
|
89% | 11 REVIEWS |
3 |
|
|
80% | 20 REVIEWS |
4 |
|
|
80% | 10 REVIEWS |
5 |
|
|
77% | 12 REVIEWS |
6 |
|
|
77% | 14 REVIEWS |
7 |
|
|
73% | 10 REVIEWS |
Category Average |
82% |
---|
Products with Insufficient Data | ||||
-- |
|
|
80% | 5 REVIEWS |
This page summarizes user satisfaction with a variety of product features. While strong and consistent performance across the board is desirable, you may be willing to tolerate low scores on features that don’t impact your primary use case or core objectives. Use this high-level data to help plan and structure your product evaluation.
Product | Overall Feature Satisfaction | Case Management | Dashboards | Feedback Loop | Integration Capabilities | Management and Sharing of Intelligence | Playbooks/Runbooks and Workflow Builder |
---|---|---|---|---|---|---|---|
Tines | 89% | 96% | 63% | 95% | 98% | 86% | 98% |
Swimlane Platform | 83% | 83% | 85% | 87% | 85% | 81% | 79% |
FortiSOAR | 82% | 81% | 83% | 79% | 78% | 83% | 91% |
Siemplify SOAR Platform | 80% | 81% | 83% | 78% | 79% | 80% | 77% |
IBM Security QRadar SOAR | 79% | 82% | 74% | 81% | 80% | 80% | 75% |
FireEye Helix SOAR | 72% | 70% | 73% | 69% | 73% | 80% | 69% |
Splunk SOAR | 71% | 75% | 73% | 63% | 73% | 68% | 77% |
CATEGORY AVERAGE | 80% | 81% | 76% | 79% | 81% | 80% | 81% |
Products with insufficient data | |||||||
---|---|---|---|---|---|---|---|
Cloud SOAR | 83% | 80% | 70% | 75% | 95% | 85% | 90% |
This page summarizes user satisfaction with a variety of product features. While strong and consistent performance across the board is desirable, you may be willing to tolerate low scores on features that don’t impact your primary use case or core objectives. Use this high-level data to help plan and structure your product evaluation.
Product | Overall Feature Satisfaction | Automated Phishing Handling | Capable of Use Case Development | Collective Analytics Layer | Data Model | Document & Artifact Storage | Integration with IR Management | Orchestrate & Automate | Team Collaboration |
---|---|---|---|---|---|---|---|---|---|
Tines | 89% | 97% | 98% | 91% | 94% | 79% | 98% | 98% | 93% |
Swimlane Platform | 83% | 80% | 83% | 87% | 80% | 80% | 83% | 84% | 84% |
FortiSOAR | 82% | 88% | 69% | 86% | 69% | 81% | 90% | 80% | 85% |
Siemplify SOAR Platform | 80% | 77% | 75% | 77% | 75% | -- | 75% | 79% | 77% |
IBM Security QRadar SOAR | 79% | 86% | 82% | 80% | -- | -- | 84% | 84% | 84% |
FireEye Helix SOAR | 72% | 75% | 70% | 73% | 70% | 70% | 70% | 70% | 85% |
Splunk SOAR | 71% | 72% | 81% | 64% | 56% | 59% | 72% | 72% | 72% |
CATEGORY AVERAGE | 80% | 82% | 80% | 80% | 74% | 74% | 82% | 81% | 83% |
Products with insufficient data | |||||||||
---|---|---|---|---|---|---|---|---|---|
Cloud SOAR | 83% | 70% | 70% | 80% | 75% | -- | 80% | 80% | 75% |
This section provides detailed information on user satisfaction for each product feature. Use these pages to dig deeper into areas of particular interest or concern.
This table lists and describes all the features that are evaluated in the Security Orchestration, Automation, and Response software category. For your convenience, these descriptions are repeated under the feature subheadings in the subsequent pages.
The solution provides the ability to create, manage, annotate, route and close service (or other cases). Claims resolution tracking.
Create multiple, custom dashboards tailored to different teams.
Leverage the feedback loop to enable faster, more accurate actions as you anticipate and thwart a threat actor's next move.
Flexible playbooks to support integration workflows and REST API to allow flexibility in integration development.
The ability to heavily leverage a REST API and represent data in a way that can be shared among multiple teams and tools. STIX/TAXII support.
Solution should enable playbook and workflow creation and modification using simple techniques—such as drag-and-drop interfaces.
Eliminate the burden of manually analyzing and remediating the growing volume of phishing emails.
Enable the organization to create use cases that may be proprietary to the organizations circumstances or environment.
Ground truth telemetry from other analysts around the globe is provided anonymously and automatically.
Flexible data model that supports bespoke indicators. Associations can be formed between different objects, e.g. between threat actors and their capabililities.
Extensible storage to meet growing needs. The ability to link documents and artifacts to relevant intelligence or other information.\r\n
Support how an organization plans, manages, tracks and coordinates the response to a security incident.
Ability to prioritize mission-critical playbooks. Performance easily monitored from central location with no execution limits and additional servers as needed.
Allows multiple users to comment on, mark-up, annotate, or edit a document. Provides team sites, workspaces or other landing areas that enhance productivity.
This section provides detailed information on user satisfaction for each product feature. Use these pages to dig deeper into areas of particular interest or concern.
The solution provides the ability to create, manage, annotate, route and close service (or other cases). Claims resolution tracking.
2 |
|
|
83% | 20 REVIEWS |
3 |
|
|
82% | 14 REVIEWS |
4 |
|
|
81% | 12 REVIEWS |
5 |
|
|
81% | 10 REVIEWS |
6 |
|
|
75% | 11 REVIEWS |
7 |
|
|
70% | 10 REVIEWS |
Category Average |
81% |
---|
Products with Insufficient Data | ||||
-- |
|
|
80% | 5 REVIEWS |
This section provides detailed information on user satisfaction for each product feature. Use these pages to dig deeper into areas of particular interest or concern.
Create multiple, custom dashboards tailored to different teams.
2 |
|
|
83% | 12 REVIEWS |
3 |
|
|
83% | 10 REVIEWS |
4 |
|
|
74% | 14 REVIEWS |
5 |
|
|
73% | 11 REVIEWS |
6 |
|
|
73% | 10 REVIEWS |
7 |
|
|
63% | 11 REVIEWS |
Category Average |
76% |
---|
Products with Insufficient Data | ||||
-- |
|
|
70% | 5 REVIEWS |
This section provides detailed information on user satisfaction for each product feature. Use these pages to dig deeper into areas of particular interest or concern.
Leverage the feedback loop to enable faster, more accurate actions as you anticipate and thwart a threat actor's next move.
2 |
|
|
87% | 20 REVIEWS |
3 |
|
|
81% | 14 REVIEWS |
4 |
|
|
79% | 10 REVIEWS |
5 |
|
|
78% | 12 REVIEWS |
6 |
|
|