Data Quadrant Awards 2022
Business Intelligence & Analytics - Midmarket
SoftwareReviews names Zoho Analytics, Dundas BI, and Microsoft Power BI as Business Intelligence & Analytics - Midmarket Data Quadrant Award Winners.
View Category
Business Intelligence & Analytics - Midmarket
Data Quadrant
Data Quadrants are proudly founded in 100% user review data and are free of traditional "magical" components such as market presence and analyst opinion, which are opaque in nature and may be influenced by vendor pressure, financial or otherwise.
The SoftwareReviews Data Quadrant evaluates and ranks products based on feedback from IT and business professionals. The placement of a software in the Data Quadrant indicates its relative ranking as well as its categorization.
Read The In-Depth Report
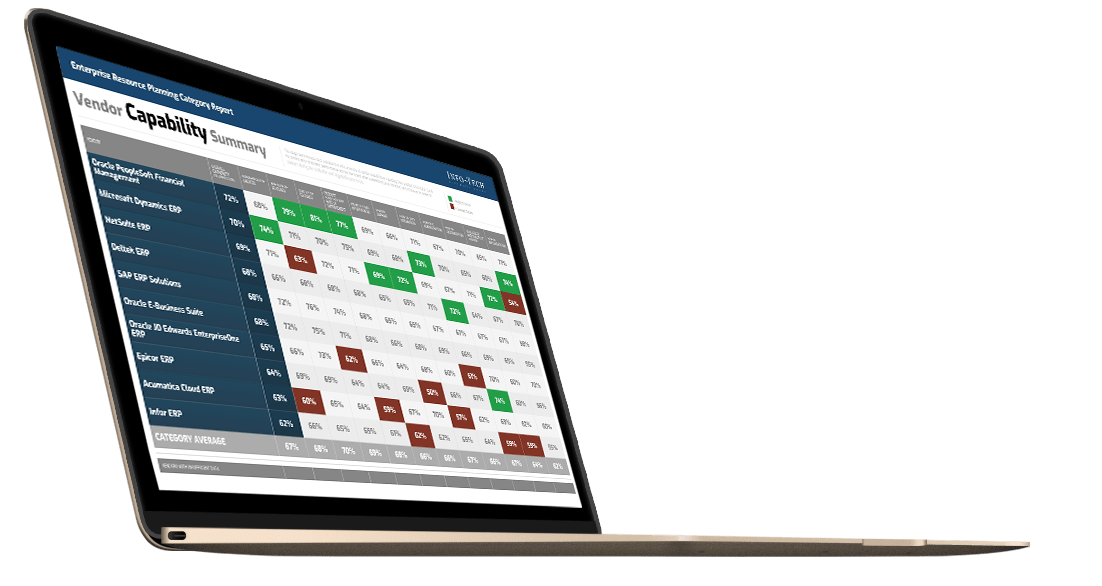
A thorough evaluation and ranking of all software in an individual category to compare software across every dimension.
- user satisfaction rankings
- |
- vendor capability comparisons
- |
- business value scores
- |
- individual feature evaluations
- |
- emotional connection to products
30+ pages

Note Software product placement is based on the scores provided by users, recency of the reviews, and review volume. Axes are dynamically adjusted based on the minimum and maximum values in the data set.
Evaluate the Complete
Software Experience
When distilled down, the software experience is shaped by both the experience with the software and the relationship with the vendor. Evaluating enterprise software along these two dimensions provides a comprehensive understanding of the product and helps identify vendors that can deliver on both.
Product Features and Satisfaction
The satisfaction is captured in the overall satisfaction score, which is driven by the likelihood of users to recommend the software, combined with user satisfaction across top product features.
Vendor Experience and Capabilities
The vendor relationship is calculated in a weighted average of the satisfaction scores tied to vendor capabilities (e.g. software implementation, training, customer support, product roadmap) as well as emotional response ratings toward the vendor (e.g. trustworthy, respectful, fair).
Gold Medalists

Zoho
Zoho Analytics
Zoho Analytics is a self-service BI and data analytics software that lets you analyze your data, create stunning data visualizations, and discover hidden insights in minutes.
8.4
Composite
Score
Composite
Score
+89
Emotional
Footprint
Emotional
Footprint
82%
Likeliness to
Recommend
Likeliness
to Recommend
Dundas Data Visualization
Dundas BI
Dundas BI gives you full control over your data so you can create stunning dashboards, embedded analytics and a personal user experience. Your business gets more than just data exploration, it gets the perfect delivery needed to act on it.
8.3
Composite
Score
Composite
Score
+85
Emotional
Footprint
Emotional
Footprint
86%
Likeliness to
Recommend
Likeliness
to Recommend

Microsoft
Microsoft Power BI
Power BI is a business analytics solution that lets you visualize your data and share insights across your organization, or embed them in your app or website. Connect to hundreds of data sources and bring your data to life with live dashboards and reports.
8.3
Composite
Score
Composite
Score
+85
Emotional
Footprint
Emotional
Footprint
86%
Likeliness to
Recommend
Likeliness
to Recommend
Vendor Capability Awards
Availability and Quality of Training
Sisense
Breadth of Features
Dundas BI
Business Value Created
Zoho Analytics
Ease of Customization
Dundas BI
Ease of Data Integration
Dundas BI
Ease of IT Administration
Dundas BI
Ease of Implementation
Zoho Analytics
Product Strategy and Rate of Improvement
Sisense
Quality of Features
Qlik Sense
Usability and Intuitiveness
Sisense
Vendor Support
Dundas BI
Other Evaluated Vendors
QlikTech
Qlik Sense
Qlik Sense is a business intelligence (BI) and visual analytics platform that supports a range of analytic use cases. Built on Qlik’s unique Associative Engine, it supports a full range of users and use-cases across the life-cycle from data to insight – with self-service analytics, interactive dashboards, conversational analytics, custom and embedded analytics, mobile analytics, and reporting. The solution comes in three different editions - Qlik Sense Enterprise, Business, and Team. Qlik Sense can be deployed in the cloud or on-premises.
8.1
Composite
Score
Composite
Score
+80
Emotional
Footprint
Emotional
Footprint
80%
Likeliness to
Recommend
Likeliness
to Recommend

Sisense
Sisense
SiSense liberates data, empowers business users and frees IT by making it easy to do the difficult tasks of accessing, joining and visualizing data.
8.0
Composite
Score
Composite
Score
+84
Emotional
Footprint
Emotional
Footprint
77%
Likeliness to
Recommend
Likeliness
to Recommend

IBM
IBM Cognos Analytics
IBM Cognos Analytics offers smarter, self-service capabilities so you can quickly and confidently identify and act on insight. The engaging experience empowers business users to create and personalize dashboards and reports on their own - while providing IT with a proven and scalable solution that is available on-premises or in the cloud.
7.9
Composite
Score
Composite
Score
+82
Emotional
Footprint
Emotional
Footprint
79%
Likeliness to
Recommend
Likeliness
to Recommend
Yellowfin
Yellowfin
At Yellowfin we are passionate about making Business Intelligence easy. As an emerging software developer on the local and international scene, Yellowfin provides 100% web-based embeddable reporting and analytics.
7.7
Composite
Score
Composite
Score
+76
Emotional
Footprint
Emotional
Footprint
81%
Likeliness to
Recommend
Likeliness
to Recommend
For the full list of vendors in this space, click here.
About Gold Medal Awards and Software Reports
SoftwareReviews Gold Medal Awards recognize outstanding vendors in the technology marketplace as evaluated by their users. Gold Medals are the capstone of an in-depth software evaluation report, and awarded using a proprietary, transparent methodology based on a composite satisfaction score that averages four different areas of evaluation: Net Emotional Footprint, Vendor Capabilities, Product Features, and Likeliness to Recommend. The Net Emotional Footprint Score measures user emotional response ratings of the vendor (e.g. trustworthy, respectful, fair).
Software Reports present comprehensive evaluations of software vendors on the above elements. Software buyers can use this data to make more informed, data-driven software purchasing and renewal decisions.
Get Instant Access<br>to this Report
Get Instant Access
to this Report
Unlock your first report with just a business email. Register to access our entire library.
© 2026 SoftwareReviews.com. All rights reserved.